Spaces tab > Reports group > ![]() Heat loss report
Heat loss report
List: S_TILALUETTELO
With this function, you can establish a table type list of the project's heat loss data to the clipboard (and to the drawing if you want).
You can make the report simple or detailed.
Do the following:
-
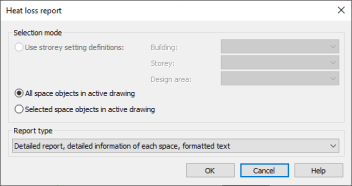
In the Heat loss report dialog, select the space objects whose heat loss report you want to create.
-
Select the type of the report:
-
Click OK. The report dialog opens. The spaces are listed according to the space number.
-
Select whether you want to convert decimal points into commas. This option is not available in the detailed, formatted report.
This setting can be used for avoiding the problems in combining the data to a spreadsheet program related to the country settings of the operating system. The Windows operating system generally uses a comma as the decimal separator, but Cadmatic uses the point as the separator (the comma has been reserved for the coordinate separator). For that reason, the decimal separation may occur falsely during exporting of numerical data from Cadmatic to a spreadsheet. If you select this setting, the function automatically converts all points to commas.
-
Select whether you want to insert the report to the drawing.
-
Click OK. If you selected to draw the report to the drawing, the Paste tabulated text dialog opens. In this dialog you can paste tabulated text from the clipboard to the columns.
Do the following:
-
Set the settings of the table type text.
-
Click OK.
-
Select the insertion point for the table in the drawing.
-
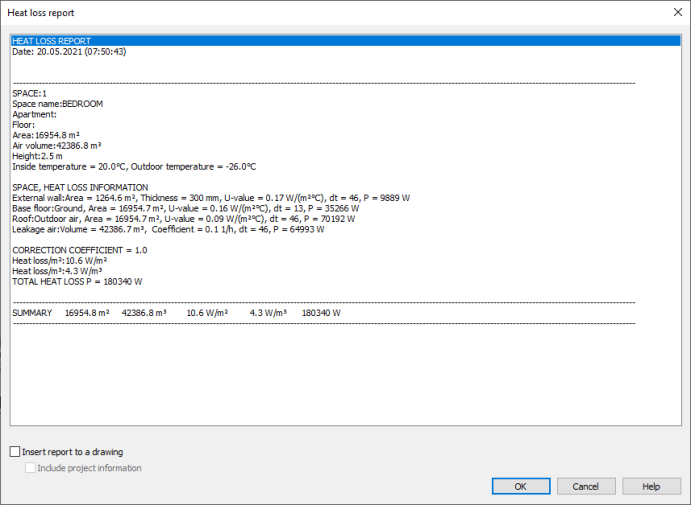
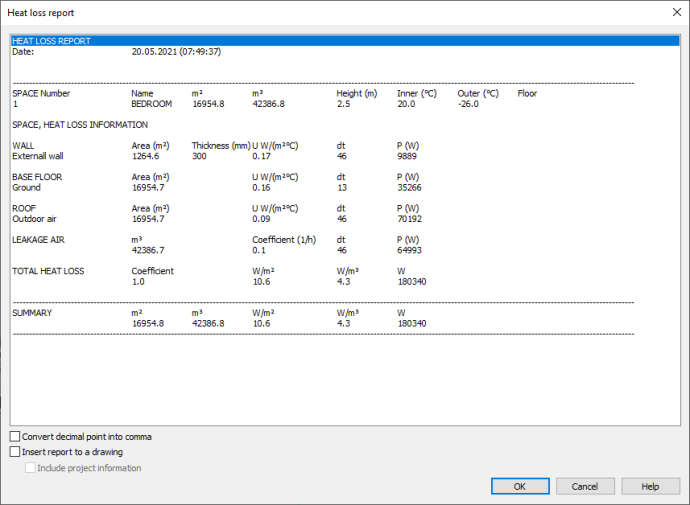
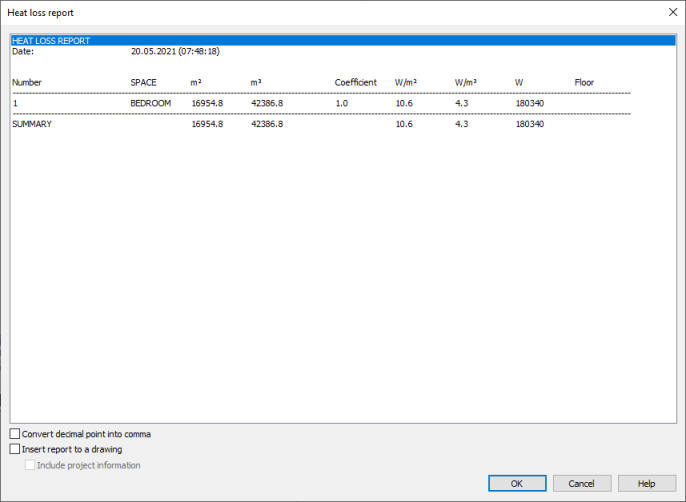
In the simple and detailed reports suitable for spreadsheet, the function copies the heat loss data of the selected space objects to Windows clipboard as text data separated by tabulation. You can then combine the data on a spreadsheet. In the detailed, formatted report, the data is copied as formatted text which you can paste to a text processing program.