Open scanner map views
With a scanner map view, you can locate the scanners in the building or the ship and see the state of each scanner. You can especially use scanner map views for opening bubble views, which are the views as seen from the scanner.
Scanner maps show the location of each scanner via 3D balls which are located at the point of the scanning position. They also show the status of the scanners via color coding.
Scanner map views are either shaded orthogonal or wire frame views with special view filter settings. For clarity, shaded view point clouds are not enabled.
Do the following:
-
Open the Plant Modeller.
-
Select Views > New > Point Cloud Views > Scanner Map. The Scanner Map Point Cloud Views dialog opens.
-
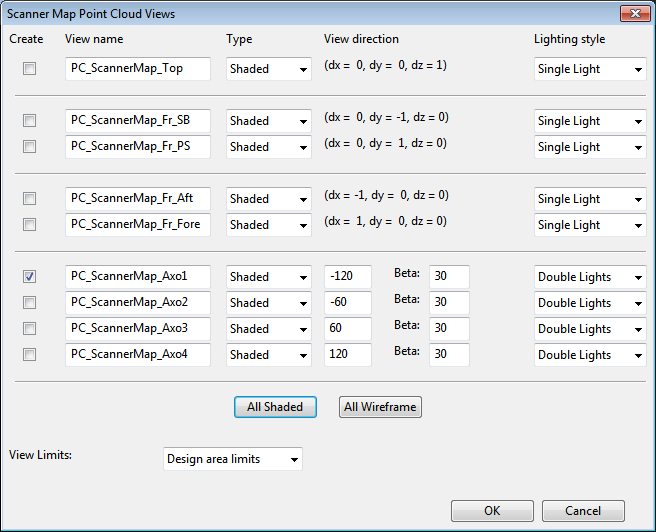
Create a default scanner map view with basic view properties, as shown in the image below:
It can be a good idea to visualize some selected elements from the main layout to the scanner map to make locating the best scanners for each area easier. You have two approaches:
-
Import or model some geometry, such as sketch walls, bigger equipment, and so on.
-
Import a 2D lay-out drawing (or a part of it) into the view.
The first alternative allows you to rotate the scanner map view freely, while the latter results in a scanner map view with a fixed and locked view direction.
Often, it can make sense to create one scanner map per floor of the plant (or deck of the ship) and name them floor-[number], and so on. You can also select Edit Filter Box or press Shift+4 to see one large view and control the elevation.
In smaller retrofit projects, you may want to also see the newly modeled 3D objects in the scanner map views, while in large scale remodeling projects, with a large amount of objects, you may rather specify a view filter rule which excludes most of the remodeled objects.
The view settings of the default scanner map are shown in the image below.
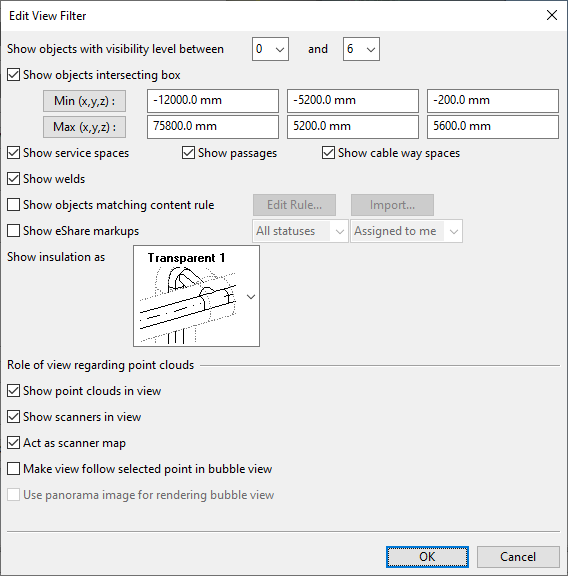
In this case, you can also define a visualization rule to only visualize the objects in the Building system.
Do the following:
-
In the Edit View Filter dialog, select Show objects matching content rule.
-
Click Import to import a query which selects the objects in the Building system to be visualized.
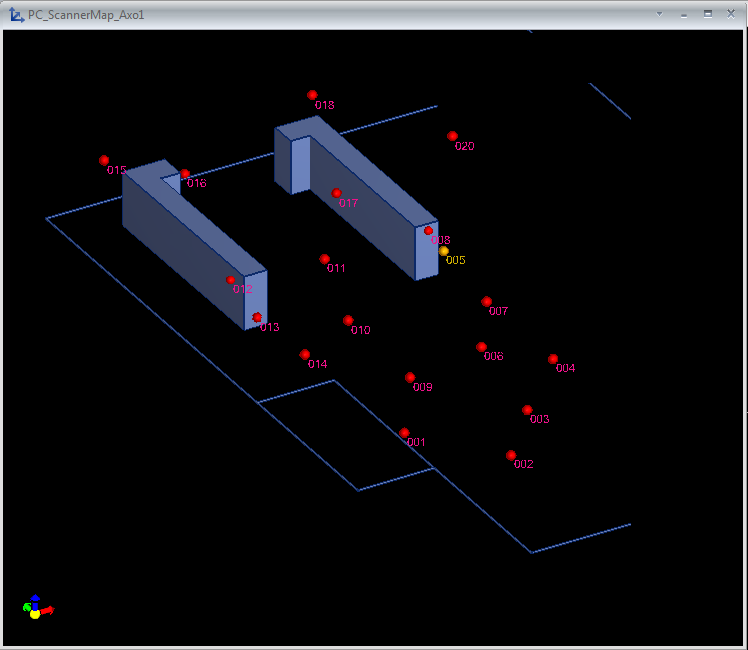
The created scanner map is a shaded view which you can rotate freely. The view shows you the scanner locations as balls. Some wall lines were modeled to the floor level as small pipes, attached to the Building system. This was done to help you visually locate the scanners better. The program automatically draws the ID numbers of the scanners next to the scanner balls. These numbers are the same as shown in the list of scanners in the Point Cloud Manager, if all scanner files follow the same naming convention, using a prefix and a number.
The color coding of the scanner balls is the following:
-
Red – the scanner is active.
-
Yellow – the scanner is inactive.
-
Green – the currently active view is a bubble view of the scanner.