View cube
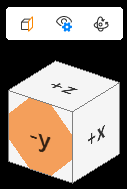
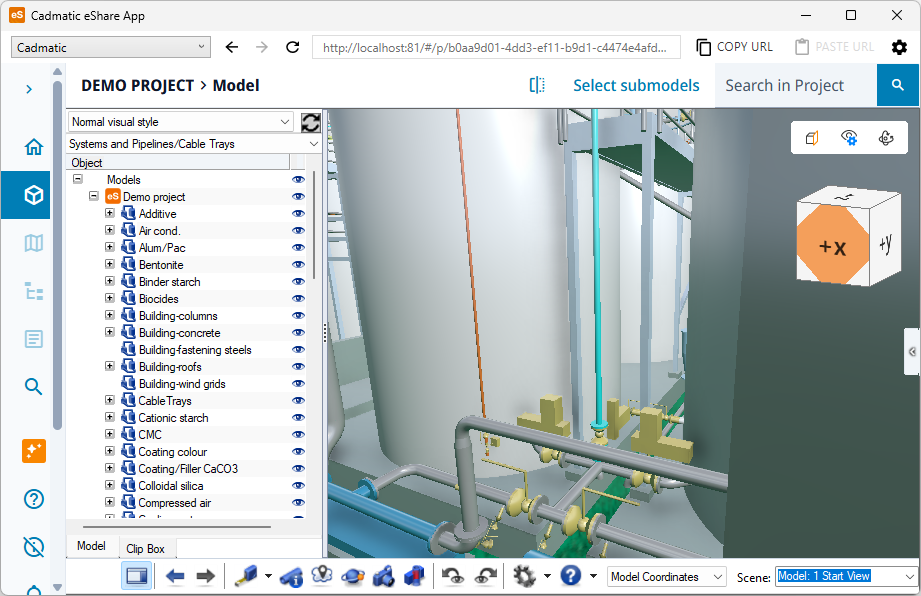
The view cube is in the top-right corner of the 3D view. It shows the current view direction, and you can use it to rotate the model or to switch to a specific view direction. Next to the cube is a toolbar with icons for the clip box, visualization, and navigation options.
-
To rotate the model, drag the view cube.
-
To view the model from a specific direction, click a face or corner of the cube.
View cube toolbar
This section describes the commands that are available in the view cube toolbar in 3D view.
Note: The availability of toolbar commands depends on the current context, such as whether a markup is open, a 4D animation is playing, or either presentation mode, or bubble view is open. Commands that cannot be used in the current context are dimmed.
Clip box

Enable clip box
Enables the clip box and opens the clip box tab. When enabled, you only see the area defined by the clip box. When disabled, you see the complete model. See Clip box tab.
Show clip control box
Enables the control box that allows you to resize the clip box by dragging the clipping planes in the 3D view. See Clip box tab.
Show clipped as wireframe
When enabled, the objects outside the clip box will be shown as wireframe. See Clip box tab.
Visualization

Visual styles
Opens a menu of visual styles to select from, including smart points.
4D animations
Select 4D sequence from the menu.
Refresh visual styles and hierarchies
Select to update visual styles, object colors and hierarchies in 3D view and model tree.
Show cable routing objects
If selected, cable routing objects are visible.
Show connection points
If selected and the model contains connection points, the connection points that are near the camera are visualized. When in Examine Mode only the connection points of the examined object are shown. Moving the cursor over a connection point displays the node number.
Note: Snapping to connection points can be toggled on or off—see Measure.
Show insulation
-
Hide – Insulations are not visible.
-
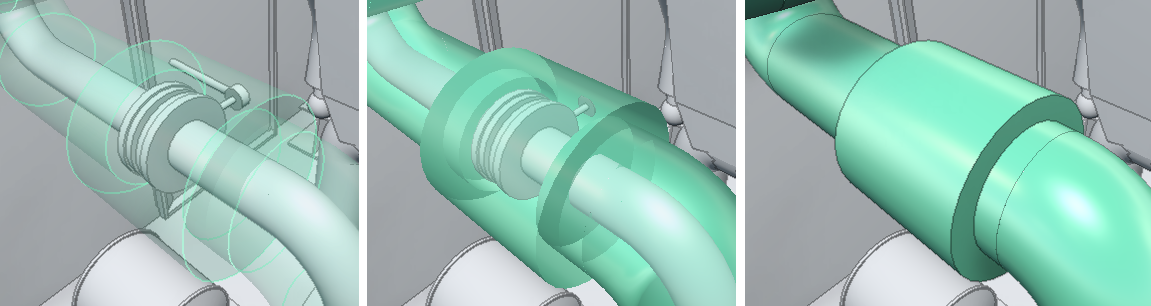
Show transparent – Insulations are transparent. Objects that are inside or behind the insulation are clearly visible.
-
Show semitransparent – Insulations are semi-transparent. Objects that are inside or behind the insulation are at least partially visible.
-
Show opaque – Insulations are completely rendered. Objects that are inside or behind the insulation cannot be seen.
 Show/hide examples
In this example, the left image displays transparent insulation, the middle image displays semitransparent insulation, and the right image displays opaque insulation:
Welds
If selected, welds are visible.
Coordinates under cursor
Shows the coordinates of the point under the cursor. If the cursor is near a point it can snap to, the coordinates of that point are shown. The first line shows the Cartesian coordinates. If the model has named coordinates, the lines below show, for each axis, the nearest named plane and the distance and direction from it.
Named coordinates are available in models that have been published with Plant Modeller version 6.0 or newer.
Maps
-
Show map – Enable showing the model’s navigation map in the lower-right corner of the 3D view. Depending on the model, there might be a number of different map types that allow you to choose whether to display blocks, compartments, service spaces, and so on.
When the navigation map is displayed, you can click the map to move the camera to the specified location. You can drag the upper-left corner of the map to resize the navigation map.
Smart Points and markups that are at the same floor or deck level as the user and inside the map area are shown in the navigation map.
For more information on maps, see Navigation map.
-
Show reference planes – Enable showing the deck or floor levels (horizontal reference planes) in the side view at the top of the map. When you point at the side view, the level under the cursor is highlighted.
Markups
-
Show markups – Enable showing markups in the 3D view and map. If they are shown, you can select which markup types and statuses to display.
Object identification labels
Enables displaying an identification label for the objects that cover the largest area of the view. Pipes display the label along the centerline of the pipe, and other objects display it next to the center point of the bounding box.
In application settings you can list the attributes that these labels can use. Each label displays the value of the highest-priority attribute (or set of attributes) that can be found from the object in question. See Other options.
Point clouds
-
Scale points by distance – Adjusts the size of each point according to its distance from the scanner. Points close to the scanner are drawn larger and distant points smaller, which gives the point cloud a stronger sense of depth and reduces visible gaps between points when you view surfaces up close. When this option is off, all points are drawn at the same size regardless of distance.
-
Show more clouds when idle – Displays additional point cloud data when the view is not moving. While you navigate, the program shows a reduced amount of point cloud data to keep movement smooth. When you stop, it loads and displays more data to show the point clouds in greater detail. Turn this option off, if you want consistent display density, or if loading extra data slows down your computer.
-
Scanner points – If selected, the point cloud scanner points are visible. Point at a marker to see the name of the scan, and click it to open the scan in bubble view.
-
Cloud differences – Activates difference mode comparing the 3D model and the point cloud in visualization. The tool is not accurate and is only meant for visualization purposes. By default, the parts where the model and the point cloud differ less than the set tolerance value are highlighted with green. The parts found only in the point cloud are highlighted with red, and the parts found only in the 3D model are highlighted with blue. Differences of 1-2 times the tolerance are shown in a mix of green and red or blue. Grey areas are too far away from the camera and cannot be compared by visualization. The tolerance value and colors can be changed in Settings > Point clouds. See Point clouds.
Reference coordinate grid
-
Show grid – Enables the reference coordinate grid in the model. Coordinate planes must be defined in the model using Cadmatic Plant Modeller. By default you can toggle z plane grid visible by clicking the plane label in 3D view. If the selection in 3D view does not work, in Grid settings you can select which planes are visualized by first disabling Toggle z planes from 3D view and selecting the planes. This is helpful if the model contains a lot of reference planes and toggling labels from 3D view becomes complicated.
-
Grid settings – Opens settings for coordinate grid settings.
The color of the grid line can be configured in the Settings menu. See Visualization.
Measure can be enabled to be used with the coordinate grid in the Measure tool options. See Measure tool options.
Smart points
-
Show smart points – Enable showing smart points in the 3D view and map. If they are shown, you can select which smart point types and statuses to display.
Navigation

Flip model upside down
Toggles the 3D view upside down and back to normal.
Turn to look
-
Horizontal (H) – Aligns the view with the horizon.
-
Down (Shift + Z) – Turns the view directly downward.
-
Up (Z) – Turns the view directly upward.
-
X+ (X) – Turns the view to point to the positive direction of the X axis.
-
X- (Shift + X) – Turns the view to point to the negative direction of the X axis.
-
Y+ (Y) – Turns the view to point to the positive direction of the Y axis.
-
Y- (Shift + Y) – Turns the view to point to the negative direction of the Y axis.
Zoom extents
-
Top view (Shift + 1) – View the model from the top.
-
Bottom view (Shift + 2) – View the model from the bottom.
-
Right view (Fore) (Shift + 3) – View the model from the right.
-
Left view (Aft) (Shift + 4) – View the model from the left.
-
Front view (SB) (Shift + 5) – View the model from the front.
-
Back view (PS) (Shift + 6) – View the model from the back.
-
Isometric view (Shift + 7) – View the model from isometric direction.
Zoom to area
Zoom to a specific area in the model. To define the area, hold down the left mouse button and drag the rectangle to the required size.
Projection
-
Perspective – View the model using the traditional projection way.
-
Orthographic – View the model using orthographic projection. Orthographic projection preserves distances in the view and objects further away are not rendered smaller than objects which are closer as in perspective projection. In orthographic view, you cannot fly with the left mouse button or the arrow keys. Use the mouse wheel to zoom. Other navigation commands are available. Creating or opening a markup switches the view to perspective projection.