Drawing sheets (ASCII)
All CADMATIC Plant/Outfitting documents can use ASCII-based drawing sheets. However, we strongly recommend creating new drawing sheets in the DWG format instead, whenever feasible—see Drawing sheets (DWG).
Creating drawing sheets
The project administrator can create new drawing sheets that use the ASCII format.
Do the following:
-
In the Project Environment dialog, browse to [library] > Document Production > Drawing Sheets.
-
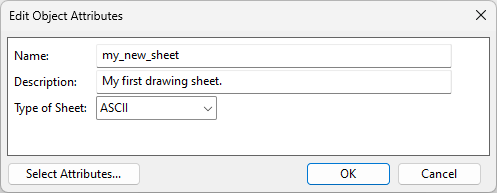
Select New > Drawing Sheet. The Edit Object Attributes dialog opens.
-
Enter a name and description, set Type of Sheet to ASCII, and click OK. The new drawing sheet is added to the library.
-
Edit the drawing sheet as described in Editing drawing sheets.
-
When the drawing sheet is ready, approve it for use in the projects.
Editing drawing sheets
The project administrator can edit ASCII-based drawing sheets using the graphical sheet editor.
To edit a drawing sheet with the graphical editor, do the following:
-
In Plant Modeller, select File > Environment > All Library and Project. The Project Environment dialog opens.
-
Browse to [library] > Document Production > Drawing Sheets.
-
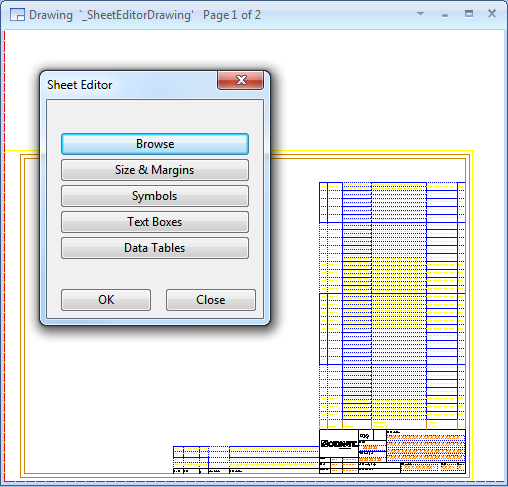
Double-click the drawing sheet to be edited. The drawing sheet and the Sheet Editor dialog open.
-
Edit the drawing sheet as required.
-
Click OK to close the editor.
-
Check in the drawing.
To edit a drawing sheet with the default text editor, do the following:
-
In the CADMATIC desktop, select Object > Library and Project Databases. The Project Environment dialog opens.
-
Browse to [library] > Document Production > Drawing Sheets.
-
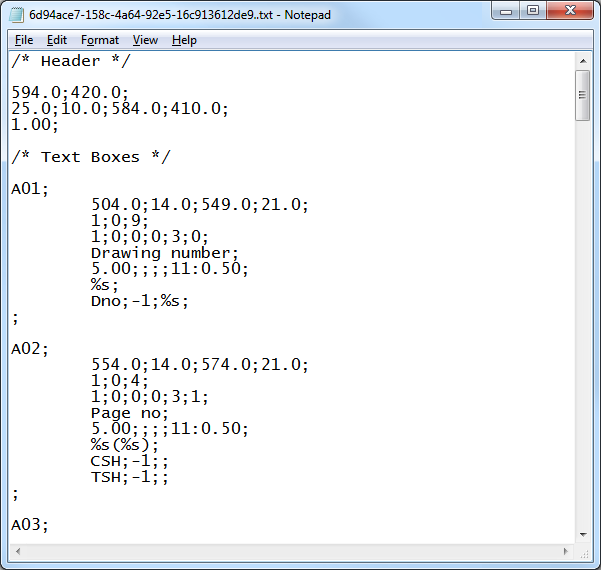
Double-click the drawing sheet to be edited. The drawing sheet opens in the default text editor of your computer.
-
Edit the drawing sheet as required.
-
Save the file and close the text editor.
-
Check in the drawing sheet.
Selecting drawing sheets
When a designer is creating a new drawing and selects the ICGD to use, the drawing sheet is the primary sheet defined in the ICGD. Thus, sheets used for one page drawings do not have to be approved for the project—it is enough that the ICGD has been approved for the project.
However, adding a new page to the document requires selecting a drawing sheet that has been approved for use in the project.
ASCII sheet format
A drawing sheet object that uses the ASCII format has the following structure:
-
HEADER
-
TEXT BOXES (= box_1 box_2 ... end_of_boxes)
-
SYMBOLS (= symbol_1 symbol_2 ... end_of_symbols)
-
TABLES (= table_1 table_2 ... end_of_tables)
Comments can be placed anywhere in the file in this format: /* comment */
HEADER
The structure of the header section: h1; h2; ...; h7;
The data fields are:
-
h1 – Width (u) of the sheet blank area (length quantity)
-
h2 – Height (v) of the sheet blank area (length quantity)
-
h3 – u min of the area reserved for the drawing (length quantity)
-
h3 – v min of the area reserved for the drawing (length quantity)
-
h5 – u max of the area reserved for the drawing (length quantity)
-
h6 – v max of the area reserved for the drawing (length quantity)
-
h7 – Text margin (length quantity), applied to all text fields
TEXT BOXES
The TEXT BOXES definition block consists of a number of text box definitions, each of which can be associated with a number of data items. When a drawing is generated, these data items are retrieved from the document's header file and plotted according to the text box definition. Also symbols from the 2D symbol library can be requested to be plotted with given parameters.
The structure of a text box definition:
-
BOX HEADER
-
DATA REQUESTS (= req_1 req_2 ... end_of_reqs)
BOX HEADER
The structure of a BOX_HEADER definition: b1; b2; ...; b21;
The data fields and their maximum lengths (in parentheses) are:
-
b1 – a string of characters (3) specifying the name of the box. This name is used to store the text into the header file if the user is allowed to edit the text. An empty string indicates the end of text box definitions, and in this case the other fields must be omitted.
Important: The name of a text box must not be any tag already used in the header.
-
b2 – u min of the box (length quantity)
-
b3 – v min of the box (length quantity)
-
b4 – u max of the box (length quantity)
-
b5 – v max of the box (length quantity)
-
b6 – number of text lines in the box
-
b7 – line spacing
-
b8 – maximum number of characters on one line
-
b9 – flag indicating the direction of text lines in the box: 1 = u-axis; 0 = v-axis
-
b10 – flag indicating if a frame is to be plotted around the box: 1 = plot; 0 = frame not plotted
-
b11 – if a single integer is present, then b11 defines the ID number of the pen used to plot the frame. The same int is used as the color ID. Instead of a single integer, the field can look like this: <int color_id> : <float line_width>. In the latter case, color_id (int) is an index to the Colors and line_width is the line thickness in mm (Line Widths).
-
b12 – flag indicating whether the filling of text lines in the box starts from the top (1) or the bottom (0) of the box
-
b13 – code defining the horizontal justification of text: 1 = left justified, 2 = centered, 3 = right justified
-
b14 – flag indicating if the user is allowed to edit the text before it is plotted: 1 = allow edit, 0 = no edit
-
b15 – a prompt string (39) shown to the user who is about to edit the text to be plotted
-
b16 – height of text (length quantity)
-
b17 – width of text, or 0 to use the default value (0.77 * height of text)
-
b18 – spacing between characters, or 0 to use the default value (0.22 * height of text)
-
b19 – slant of text, between -90....90 degrees
-
b20 – pen ID, or color + line width, see b11
-
b21 – format (59) that controls how the strings resulting from the data requests are combined to form the output. Must contain as many occurrences of "%s" as there are data requests for this box.
Note: b17 and b18 are not applicable to Windows fonts.
Data Requests
DATA REQUESTS consists of a variable number of data requests each having the following structure: r1; r2; r3;
The data fields and their maximum lengths (in parentheses) are:
-
r1 – a string of characters (3) identifying the target of the request. This can be a document header tag (see Header file for document) or it can be the creation date ("DAT") or creation time ("TIM") obtained from the system (see DATE and TIME formats). An empty string indicates the end of requests, and in this case the other fields must be omitted.
-
r2 – a number specifying the quantity type of the data (NS, LENGTH ...) identified by r1. If -1 then the data is not considered numeric.
-
r3 – a format string (11) specifying how the numeric data is to be output. If empty then conversion takes place according to the format specified in the quantity definition table for this quantity. These were described in chapter 3. For system parameters (time, date) this field contains a parameter specific output format selector.
SYMBOLS
The SYMBOLS definition block consists of a variable number of symbol definitions. The structure of a symbol definition is as follows: s1; s2; ...; s6;
The data fields and their maximum lengths (in parentheses) are:
-
s1 – a string of characters (13) specifying the name of the symbol to be plotted. The symbol must be found from the active symbol library. An empty string indicates the end of symbols, and in this case the other fields must be omitted.
-
s2 – u-coordinate of the local origin of the symbol (length quantity)
-
s3 – v-coordinate of the local origin of the symbol (length quantity)
-
s4 – A number specifying the scale applied to the symbol in u-direction
-
s5 – A number specifying the scale applied to the symbol in v-direction
-
s6 – Rotation angle from the default orientation (angle quantity)
TABLES
A table is a two-dimensional arrangement of rows and columns. The data appearing in the rows is retrieved from a data file, which may be generated by an ICGD, or it may originate from some other system, or the user may have edited the file. Each table is associated with a document-specific ASCII data file that is output to the table when the drawing is plotted. The names of these files are formed by adding a table-specific extension to the end of the document name. These files provide a way to get information from other systems into the drawings. For example, results of a stress analysis program could be presented in tabular form on the isometric drawing of a pipeline.
ASCII data files that are associated with tables can be characterized as follows:
-
They consist of records.
-
Each record may contain a variable number of data fields. The end of a record is indicated by an empty data field.
-
Data fields consist of two parts: a name and actual data string.
-
The name is used to associate a field with a given column in the table.
-
Each data field is delimited with a semicolon.
The TABLES definition block consist of a variable number of table definitions. The structure of a table definition is as follows:
-
TABLE HEADER
-
COLUMNS (= col_1 col_2 ... end_of_columns)
TABLE HEADER
The structure of TABLE HEADER is as follows: t1; t2; ...; t13;
The data fields and their maximum lengths (in parentheses) are:
-
t1 – string (3) specifying the extension of the file that is associated with this table. An empty string indicates the end of tables, and in this case the other fields must be omitted.
-
t2 – u min of the table (length quantity)
-
t3 – v min of the table (length quantity)
-
t4 – u max of the table (length quantity)
-
t5 – v max of the table (length quantity)
-
t6 – number of rows in the table
-
t7 – number of rows to be filled before leaving empty rows
-
t8 – number of rows to be left empty between filled rows
-
t9 – flag indicating the direction of rows in the table: 1 = u-axis; 0 = v-axis
-
t10 – code indicating how the frame is to be plotted around the table: 0 = no frame; 1 = frame all rows; 2 = frame filled rows only and position the table so that it starts from v_max or u_min, 3 = frame filled rows only and position the table so that it starts from v_min or u_max
-
t11 – pen id, or color + line width, see b11
-
t12 – flag indicating whether the filling of rows in the table starts from the top (1) or from the bottom (0) of the table
-
t13 – flag indicating if text is allowed to continue to the next row: 0 = not allowed, 1 = allowed
COLUMNS
The structure of COLUMNS is as follows:
-
COLUMN HEADER
-
DATA REQUESTS (= req_1 req_1 ... end_of_requests)
Column Header
The structure of COLUMN HEADER is as follows: c1; c2; ...; c14;
The data fields and their maximum lengths (in parentheses) are:
-
c1 – string (3) specifying the name for the column. An empty string indicates the end of columns, and in this case the other fields must be omitted.
-
c2 – lower row position of the column (length quantity) relative to the origin of the table
-
c3 – upper row position of the column (length quantity) relative to the origin of the table
-
c4 – number of sub-rows in the column
-
c5 – maximum number of characters in the column
-
c6 – code defining the horizontal justification of text as follows: 1 = left justified; 2 = centered; 3 = right justified
-
c7 – flag indicating if the contents of the column is to be queried from the user: 1 = query; 0 = no query (NOT implemented in the current version, use 0)
-
c8 – prompt string (39) shown when the user is to input the text to be plotted. (NOT implemented in the current version, leave empty)
-
c9 – height of text (length quantity)
-
c10 – width of text, or 0 to use the default value (0.77 * height of text)
-
c11 – spacing between characters, or 0 to use the default value (0.22 * height of text)
-
c12 – slant of text (must be between -90....90 degrees)
-
c13 – pen id, or color + line width, see b11
-
c14 – format string (59) that controls how the strings resulting from the data requests are combined to form the output. Must contain as many occurrences of "%s" as there are data requests for this box.
Data Request
Consists of a variable number of data requests each having the following structure: r1; r2; r3;
The data fields and their maximum lengths (in parentheses) are:
-
r1 – a string of characters (3) identifying the target of the request. This must be one of the following: a reference to one of the data fields found in the records of the data file associated with this table; a document header tag (see Header file for document); the creation date ("DAT") or creation time ("TIM") obtained from the system (see DATE and TIME formats). An empty string indicates the end of requests, and in this case the other fields must be omitted.
-
r2 – a number specifying the quantity type of the data (NS, LENGTH ...) identified by r1. If -1 then the data is not considered numeric.
-
r3 – a format string (11) specifying how the numeric data is to be output. If empty, then the conversion takes place according to the format specified in the quantity definition table for this quantity. For system parameters (time, date), this field contains a parameter specific output format selector.