Using the Table tab
The Table tab of the dialog box displays all first and last hull line points along with all their properties. This tab gives the user an opportunity to add extra points to the hull lines, and review and edit the properties of these points including intersection planes. Creating the optimum plane for each hull line helps achieving the best possible shell frames. This chapter lists all important part of the Table tab interface and provides you with instructions how to use these functions.
Defining grid-coordinates in the Column field
When hovering over the Column field, a tool tip appears explaining how to define grid coordinates for defining extra points.
In order to add extra points to the hull lines, you need to create a definition for the grid first that generates the columns of the table. That definition consists of:
- defining specific grid-coordinates and/or intervals on a dimension axis
- choosing the axis with the Length/ Width/ Height button
You can adjust this field by adding values separated by commas in the text field. Read how to add values in the chapter.
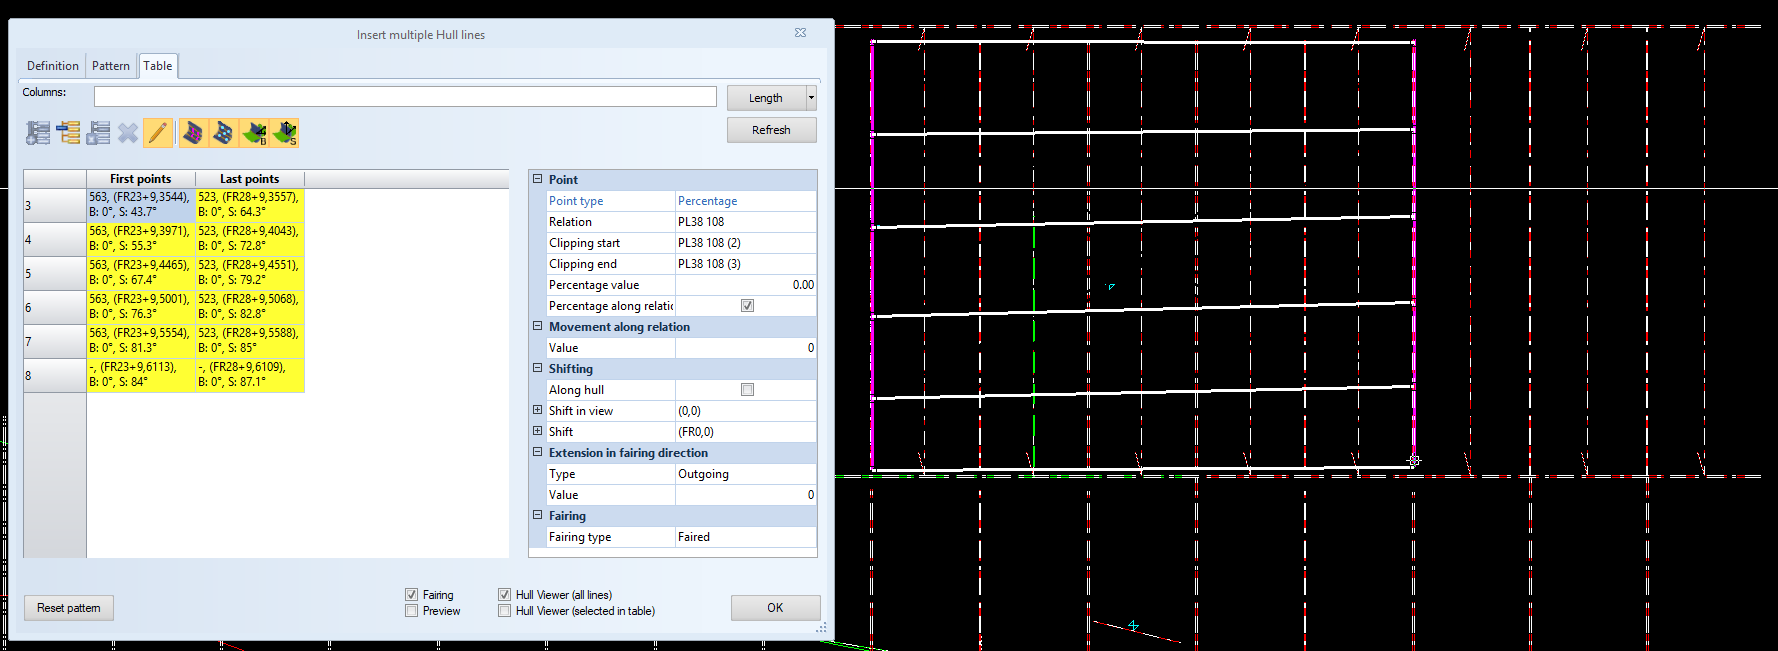
The table
The table displays a combination of first and last points on the hull lines and the defined grid lines.
Initially, when starting the dialog, the table is empty. As soon as the user defines a valid pattern with start and end points, the table gets automatically updated with a column for start, and, respectively, end points.
The table is disabled when the information in it is out-of-date compared to the lines. In this case it is not possible to add or remove points as all displayed information is stale. Use the Refresh button to update the table. If during the refresh process the system encounters an error, the table remains disabled.
The table contains the following information:
- Rows represent the hull lines. The number of each hull line is displayed in the header of the row.
- Columns are defined by using the grid-coordinates and steps formula
- Cells only contain read only information. You can edit the information if the cells by selecting it and clicking the Show properties button in the toolbar.
The background of a cell is grey when no points can be inserted (for example if the coordinate does not intersect the line, or if the line has a first or last point at that coordinate) and yellow when there is already a point defined in the line at that coordinate. The background of the cells is white when you can insert extra points.
You can also select any of the hull line point in the graphical window. The point will be automatically selected in the table as well.
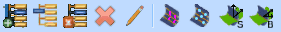
The toolbar
The user has the ability to customize the definitions of the final hull lines. The toolbar section allows users to add more points to the lines, at intervals defined by the grid they created in the table. To do that, the user selects one or more cells of the table and then performs the appropriate action from the toolbar.
Go to Adjusting values in the table and Refining line definitions to learn how to change the hull line definitions by using the toolbar and adjusting information in the property grid.
Refresh button
The Refresh button will first apply the changes that were made in the table to the hull lines and then attempt to recalculate display information currently chosen in the toolbar. To do that, a re-evaluation all points of lines will take place (it will, of course, consider the possible extra points added in the table). If re-evaluation fails, the table stays stale.
It is possible that some points have become invalid, for example because their hull lines no longer extend to their coordinates. In this case the points are removed and the user is given a warning that this removal took place.