Elongation report template
The parts of the elongation report are defined in the elongation report template, elongationreport.xls. The system generates all elongation reports based on the template. The template can be customized in Excel to suite the production's needs. The location of the template file is the cvar subfolder in the project norms.
The system includes the contents of the cells in the template in the elongation reports as such, except when the cell contains a note (also called a comment, depending on the Excel version) containing one or more keywords. In that case the content of the cell is determined by the keyword value(s).
Names of the logistical fields can be used as keywords. There are also some keywords that are used specifically for elongation reports, as follows:
-
crvType – The shell plate's curvature type (flat, conic, elliptic or hyperbolic). Keywords crvMin and crvMax can be used in the same cell to add the minimum and the maximum curvature values. These keywords are meant to be used in the General shell plate information part of the report template.
The values (names) for the curvature types are set as Curvature Descriptions in System Management > Production > Shell Plates Elongation List > Settings. The default values are Flat, Conic, Elliptic paraboloid and Hyperbolic paraboloid.
-
Variables for Extremity rules for elongation reports and Color rules for elongation reports
-
imagestarinx – An image showing the horizontal elongation
-
imagestrainy – An image showing the vertical elongation
-
imageshearstrain – An image showing the deformation in angles
-
elo_tbl_first and elo_tbl_last – The top and the bottom shell plate line in the elongation table, respectively. See Elongation table below.
-
Variables for the relations length table. See Relations length table below.
-
image3D – A 3D image of the shell plate and its templates
Sample images can be added to the template. A sample image is replaced with the generated relevant image in each elongation report. The size of the sample image is used for the generated image. When adding a sample image to these cells, make sure that the upper left corner of the image is placed inside the cell which contains the note (comment) with the keyword.
Parts of the elongation report template
A good elongation report is a combination of several parts, described in the sections below.
-
General shell plate information
-
Shell plate image showing the horizontal elongation with value labels and a color map
-
Shell plate image showing the vertical elongation with value labels and a color map
-
Shell plate image showing the plate deformation in angles and a color map
-
Color legends for indicating the elongation values in the color maps
-
Elongation table showing the elongation values for each template of the shell plate
-
Table showing the shell plate's relations, their lengths before and after deformation, and the elongations of the relations
-
3D image of the bent shell plate and its templates
Note: The images with color maps and the elongation table present the elongation information differently, and it is recommended to only include either the images or the table in the report, along with images of the templates. Which method to choose to present the information depends on the preference of the production personnel who bend the shell plates, and the used bending process. It is possible to include both if so desired, but in that case the production personnel should be aware of the differences in the presentation of elongation. For more information, see Differences in the elongation in the images and the table.
General shell plate information
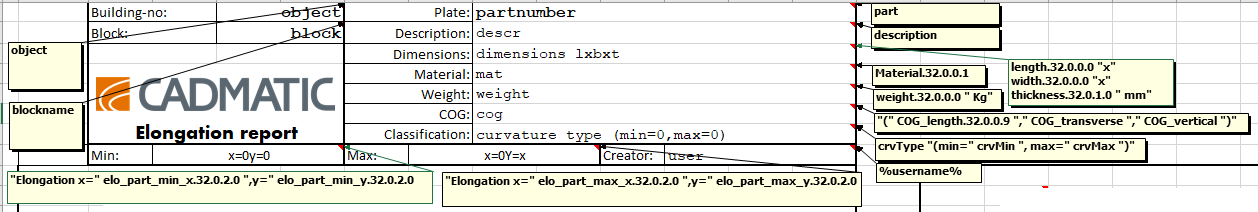
General shell plate information in the elongation reports typically include information like work breakdown data (object, block and part numbers), company name and/or logo, description, dimension, material, weight, CoG, classification (curvature type), min/max elongation and report creator (user).
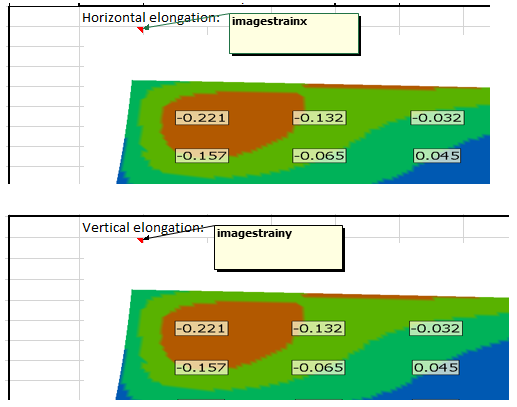
Shell plate images with elongation values and color maps
The horizontal and vertical elongations of the shell plate are shown separately on top of shell plate images. The images are based on coded shell plates (DXF). Elongation is shown in labels which contain elongation values. The labels are placed at grid points on the shell plate. The values represent the horizontal (x) or vertical (y) strain in mm/meter along the shell plate. The distance of one meter is the default value which can be changed in System Management > Production > Shell Plates Elongation List > Settings > Elongation Factor.
Elongation is also show in color maps where the different colors represent different amounts of elongation. The colours used are set in the Color Map – Color Rules setting in System Management > Production > Shell Plates Elongation List.
Keyword imagestarinx is used for the horizontal elongation image, and keyword imagestrainy for the vertical elongation image.
A warning can be shown in the elongation report if the hard-coded maximum meshing tolerance of 0.1 is exceeded on a plate. This can happen when the number of mesh nodes on the plate has been decreased or when the plate is fairly big. In such cases it is possible that the system actually uses a meshing tolerance bigger than the maximum. Too big meshing tolerance can lead to inaccurate elongation information in the shell plate elongation report. The plate should be split if the maximum meshing tolerance is exceeded.
The warning is inserted to a cell by adding a note (comment) containing the mesh_tol_warning keyword to it. In the default elongation report template the meshing tolerance warning is placed below the horizontal elongation map.
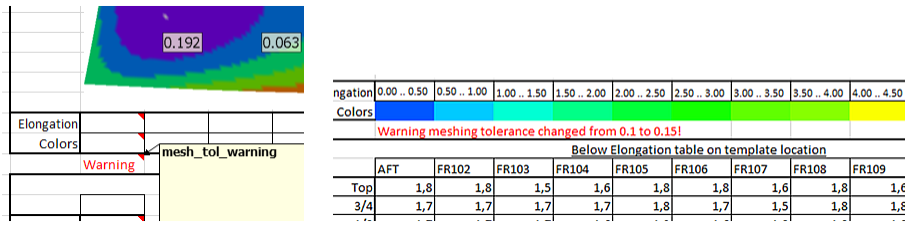
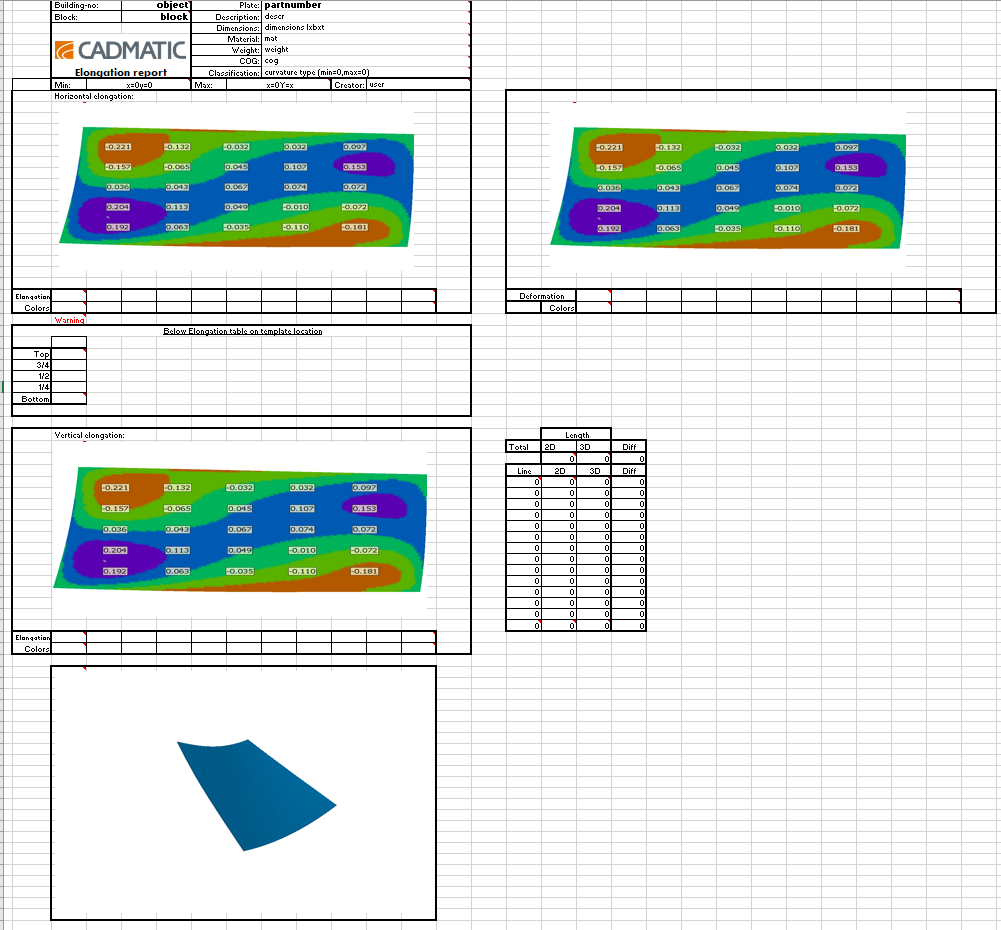
Left: Elongation report template – Right: Result in the elongation report
The warning text that is shown is defined in System Management > Production > Plate Cutting Data > Shell Plates > Settings > Meshing Tolerance Warning Text.
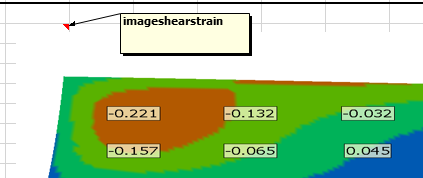
Shell plate image with deformation in angles
A third shell plate image shows the plate deformation in angles, both in labels and in a color map. The values in the labels represent the angle of shear strain (x,y).
Keyword imageshearstrain is used for the angular deformation image.
Color legends
The color legend tables show which elongation value ranges the different colors represent on the shell plate images. The color legend tables are defined by using keywords (in notes) that mark the first and the last cell of the value range and the color range. This is done separately for the horizontal, vertical and deformation in angles (shear strain).
Which cells in the tables are used for the numerical values and which are used for the colours are defined by using the following keywords:
-
legend_x_txt_first legend_x_txt_last – The first and the last cell for the horizontal elongation values.
-
legend_x_col_first legend_x_col_last – The first and the last cell for the colors representing the horizontal elongation.
-
legend_y_txt_first legend_y_txt_last – The first and the last cell for the vertical elongation values.
-
legend_y_col_first legend_y_col_last – The first and the last cell for the colors representing the vertical elongation.
-
legend_shear_txt_first legend_shear_txt_last – The first and the last cell for the deformation in angles (shear.
-
legend_shear_col_first legend_shear_col_last – The first and the last cell for the colors representing the deformation in angles.
The number of cells between and including the first and the last cell determine the step size of the elongation value ranges. The default elongation report template is using 11 cells. This can be changed by repositioning the relevant _first and/or _last keywords. Similarly, the number of the color cells can be defined by the positioning of the _first and _last keywords.
In the default elongation report template the values and colors run horizontally from the lowest value on the left to the highest on the right.
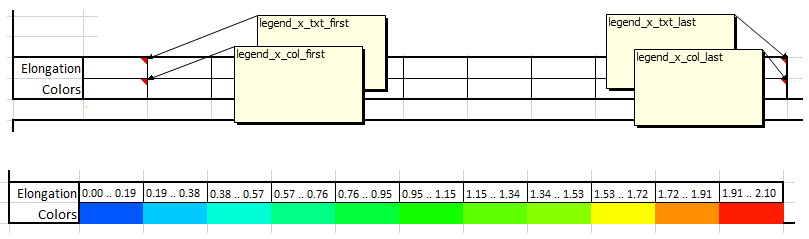
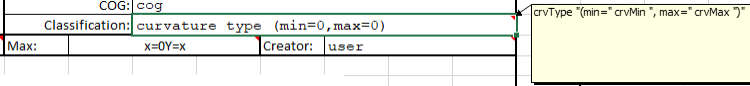
Top: Keywords in the elongation report template — Right: Result in the elongation report
Also the colors that are used in the legends are defined separately for the horizontal and vertical elongation, and the deformation in angles.
The colors used in the color maps are defined in System Management > Production > Shell Plates Elongation List > Color Map – Color Rules.
See Color rules for elongation reports for information on how to set the colors for the elongation values, and the variables and constants that can be used when defining the rules.
Elongation table
The elongation table is an alternative way of calculating and presenting the elongation information, and it can be included in the report template instead of the shell plate images with labels and color maps. Instead of the horizontal and vertical strain in mm along a distance set in Elongation Factor, in the table elongation is calculated as an average of the strain values at 9 points. See Calculation below.
-
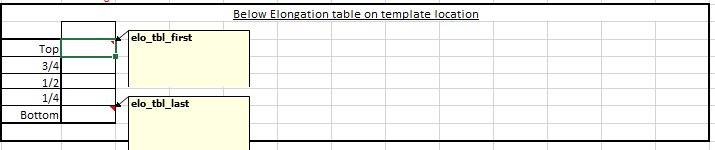
The rows represent points on the shell plate at the location of each template (intersection points). The number of rows can be freely defined. The first and the last point must be defined with keywords elo_tbl_first and elo_tbl_last, respectively. The system distributes the points between the first and the last point evenly. In the default elongation report template the rows represent points in the height of the shell plate.
-
The system adds a column for each template position. This is typically a frame value, in which case the templates run from aft on the left to fore on the right. Template descriptions are used as column headers, for example AFT, FR##, FR##, ... FWD for templates at frame values. The cells will contain elongation values at the intersections of the shell plate and the templates.
The rows and the columns can be switched, i.e. instead of rows it is possible to use columns for the points on the shell plate, and rows for the template positions. To do this, place the elo_tbl_first and elo_tbl_last keywords on the top row instead of the first column.
Note: The elo_tbl_first and elo_tbl_last keywords must be placed in the same column or on the same row.
If summations are added below or to the right of the elo_tbl_first and elo_tbl_last keywords, they will be copied to all subsequent columns or rows.
Example
The example below illustrates how the intersection points are placed on the shell plate when the elongation table in the default elongation report is used. In this example the templates are located at frames. The resulting table in the elongation report has a row for each point, and a column for each template. The cells below the top row and to the right of the first column represent intersection points of the shell plate and a template, and contain elongation values.
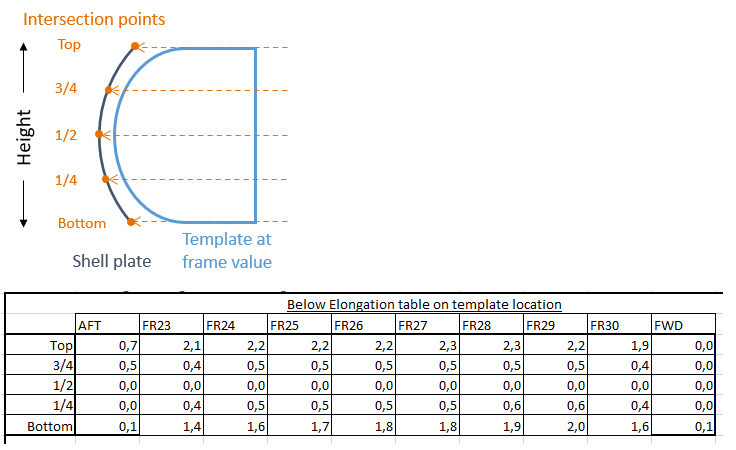
Note: Depending on how the templates are created they can also be located in height or width.
Differences in the elongation in the images and the table
Both the calculation and the presentation of elongation differs in the shell plate images and the elongation table.
For the labels in the images, elongation is calculated as the horizontal (x) and vertical (y) strain in mm per a certain distance. The distance is set in System Management > Production > Shell Plates Elongation List > Settings > Elongation Factor.
For the elongation table, elongation is calculated as an average of the strain values at 9 sample points on the shell plate (a midpoint and 8 surrounding points).
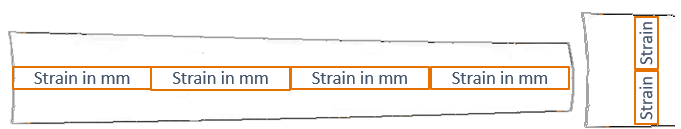
Elongation calculation in the images: horizontal and vertical strain
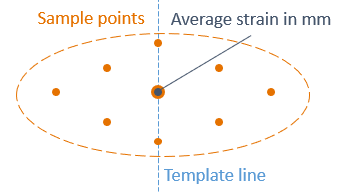
Elongation calculation in the table: strain average of 9 points
Presentation
The labels in images show the elongation in mm at different points on the shell plate per the distance set in Elongation Factor (1000 mm by default). Horizontal and vertical elongations are presented in separate images. The image is based on the coded shell plate.
The elongation table shows the elongation values at intersection points with each template, perpendicular to the template line.
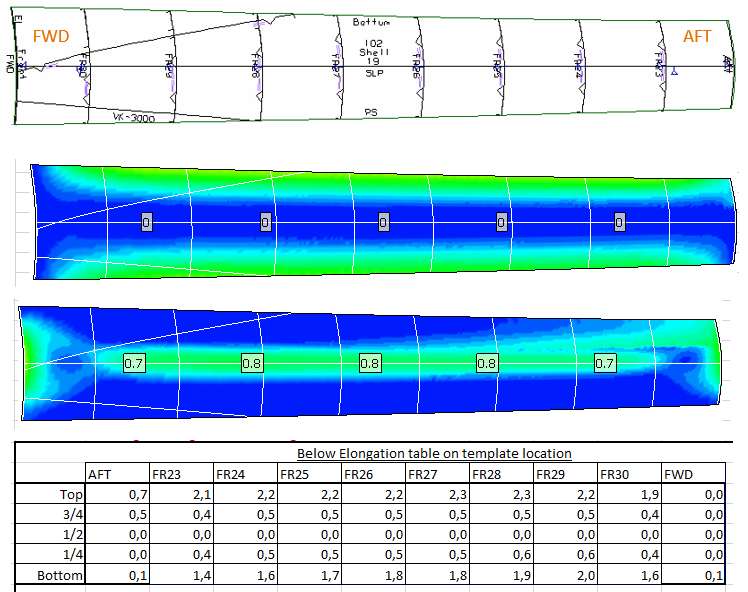
From top to bottom: Coded shell plate, color maps and labels for horizontal and vertical elongations, elongation table
Note: In this example the frames in the table run from the aft side on the left to the fore side on the right, while in this the shell plate images have the fore side presented on the left and the aft side on the right, because the images are based on the coded shell plate.
Relations length table
The relations length table shows a list of the shell plate's relations, and the length of the plate contour along those relations in 2D and 3D, as well as the total length of the plate borders.
-
The 2D length is the length before deformation (unfolded length), and it is measured over the coded plate.
-
The 3D length is the length after deformation, and it is measured over the folded shell plate.
The Diff column shows the amount of elongation along each relation and the total elongation. The elongation equals 3D length minus 2D length.
The following keywords can be used in the notes (comments):
-
hull_line_first – This keyword is for the name of the first relation (hull line). Subsequent relations will be placed in the cell below or to the right, depending on where the note containing the hull_line_last keyword is placed.
-
hull_line_last – This keyword is for the name of the last relation (hull line). The note must be placed in a cell with the same row or column number as the cell where the note containing the hull_line_first keyword is. Note that if a shell plate has more relations than fit between the first and last entries, they will not be placed in the table.
-
relation_length2D_first – Works like hull_line_first, and marks the start of the 2D length entries.
-
relation_length2D_last – Works like hull_line_last, and marks the end of the 2D length entries.
-
relation_length3D_first – Works like hull_line_first, and marks the start of the 3D length entries.
-
relation_length3D_last – Works like hull_line_last, and marks the end of the 3D length entries.
-
contour_length2d – Total length of the contour of the unfolded plate.
-
contour_length3d – Total length of the contour of the plate itself (folded plate).
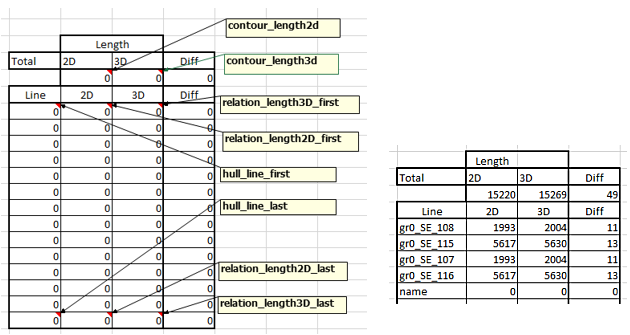
Left: Keywords in the template — Right: Possible outcome in the elongation report
3D image of the shell plate and its templates
A 3D image of the bent shell plate and the templates that belong to it (if available) can be included in elongation reports. The image provides production with an overview of the complexity of the shell plate.
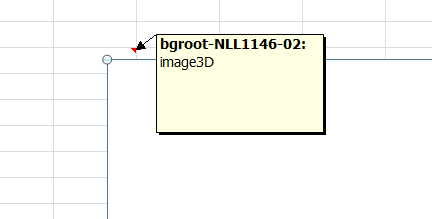
The image is included in the elongation report template by adding a note containing the image3D keyword.
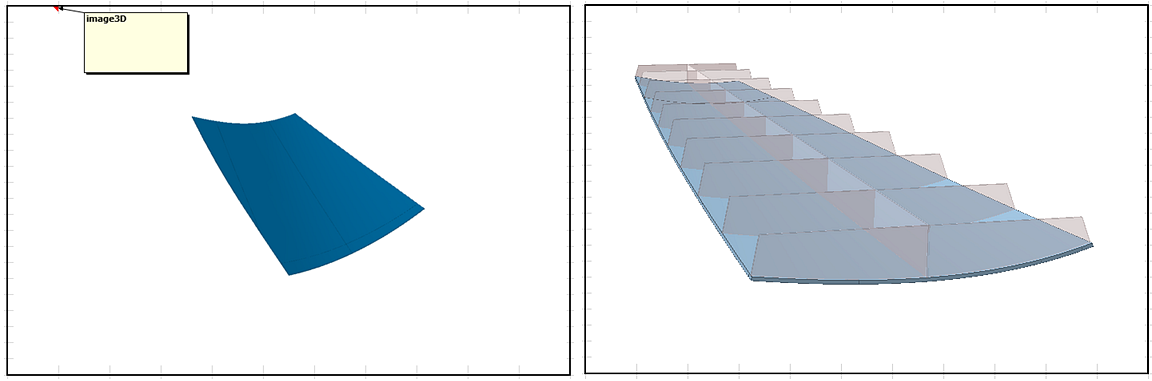
3D shell plate image in elongation report template, and an example of the result in an elongation report