Tools tab
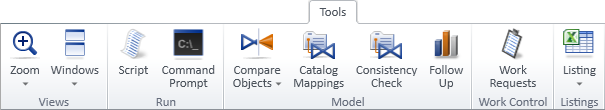
The Tools tab of P&ID includes the following tool groups.
Work control

On the Tools tab, the Work control group includes the following tools.
Work request | Document request | Follow up
Work request

Select Tools tab > Work control group > Work request to open the Work Request Manager tool where CADMATIC application users can communicate with each other. For more details, see Work requests.
Document request

Select Tools tab > Work control group > Document request to open the Manage Document Requests tool where you can manage document requests coming from Wave.
Follow up

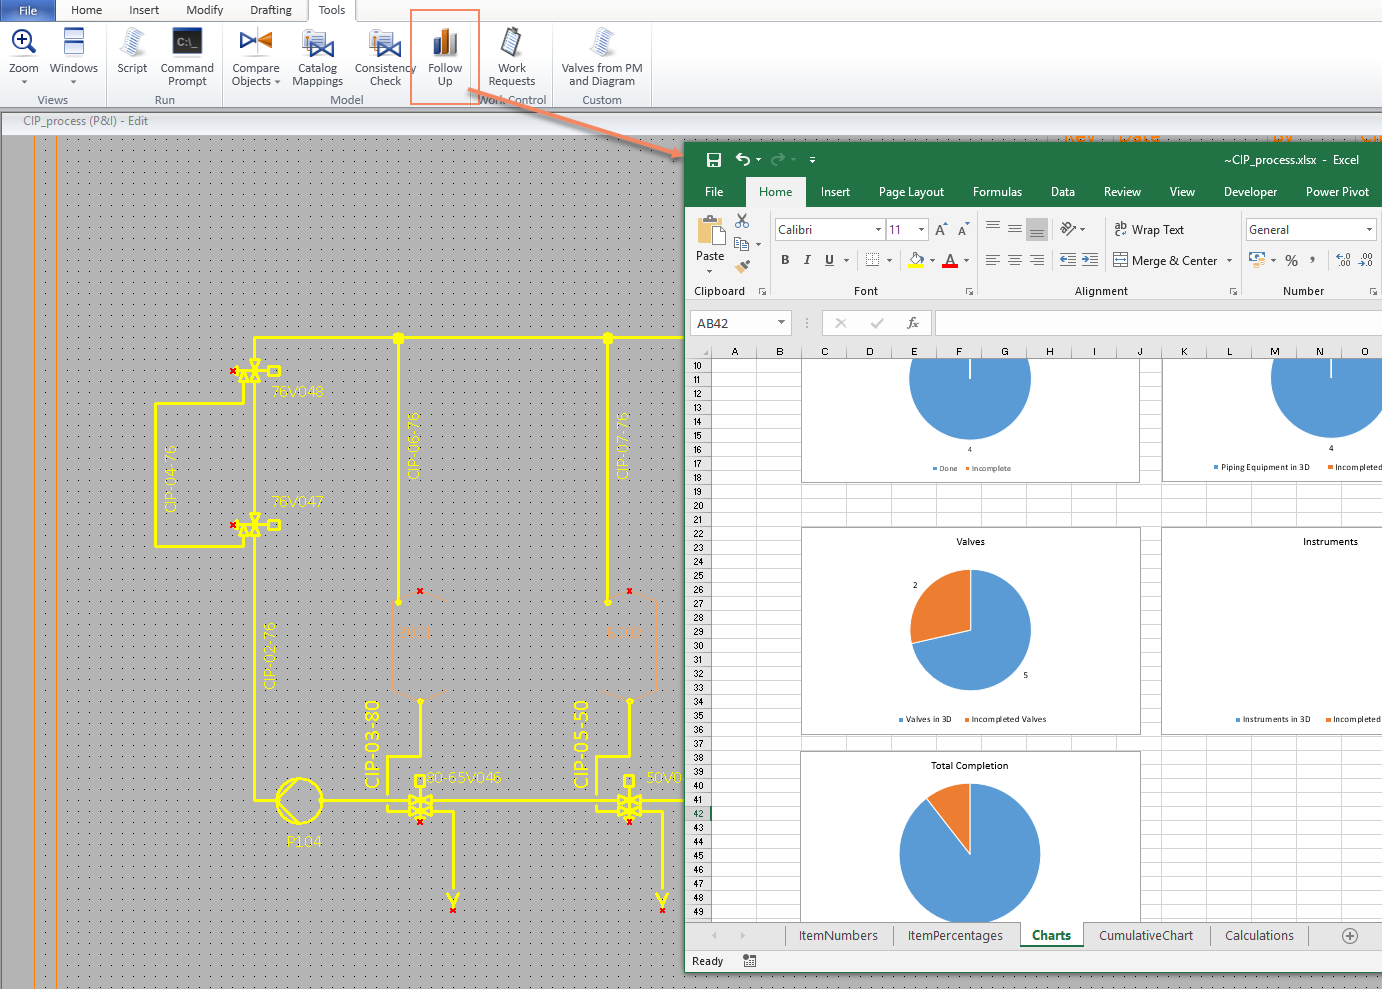
Select Follow Up to create a Microsoft Excel report of how many instances of each object type have been inserted into the active diagram and how many of them exist in the respective 3D model in Plant Modeller. When there are multiple similar projects, the report can give a good overview of how much work is completed for each diagram and how much of the routing exists in 3D.
Before the report opens, you are prompted whether to save the results in the document folder of the project. If you accept to save, the current results are added to an existing report file, so that information accumulates over time.
The follow-up report is created from an Excel Template stored in COS. A default report has two sheets, but the template can be fully customized. Project administrator can define a custom template for the project, and all diagrams will then use that template. If the template needs to be edited after it is taken into use, it can be found from the user area when the diagram is checked out.
The CADMATIC example project contains a follow-up report that also shows the results as a pie chart per object type, and there is a cumulative report of readiness in percentages.
Consider the following:
-
If the diagram is in browse mode, the report can be run but not saved.
-
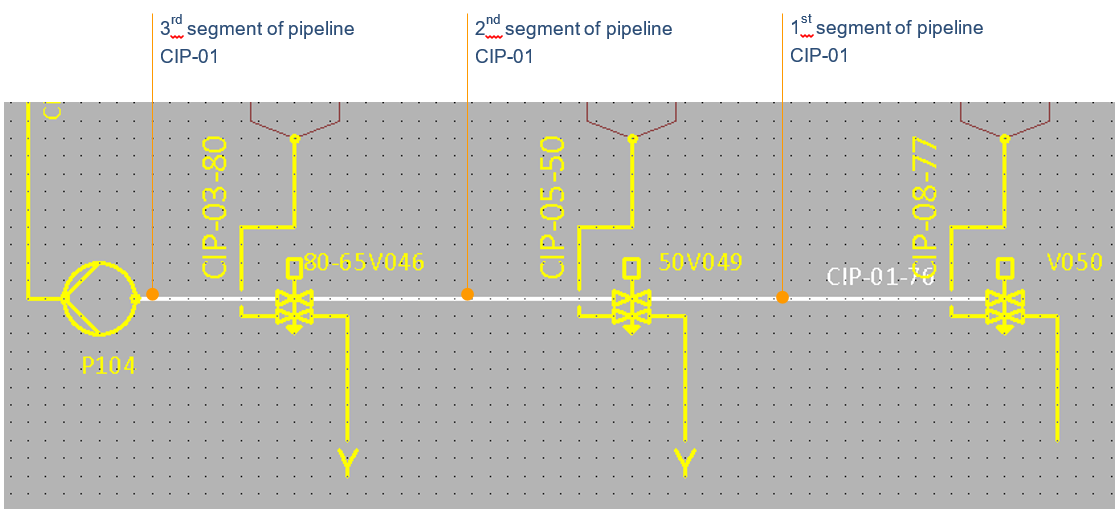
Routed pipes are calculated in segments, not in meters. The tool does not know if the segments are of very different lengths, and readiness is only an approximation.
-
Cables are not included in the report.
-
In the report:
- "Number of Equipment" shows the total number of equipment.
- "Number of Piping Equipment" shows how many pieces of equipment are connected to a piperun.
- "Number of Valves" show how many diagram objects are under the main table ARMATURES and have a Position ID.
- "Number of Piping Connections of Equipment" shows how many connection nodes exist between equipment and piperuns.
For information on the Follow Up Report tool of Plant Modeller, see Project follow up.
Launch
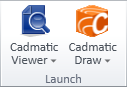
On the Tools tab, the commands in the Launch group allow launching other CADMATIC applications.
Cadmatic Viewer | Cadmatic Draw
Cadmatic Viewer

On the Tools tab, you can open the CADMATIC Viewer application to create or view 2D drawings.
-
Create DXF/DWG – Opens CADMATIC Viewer with a blank drawing. You can create a drawing and then save it in DXF or DWG format.
-
Open DXF/DWG – Opens a dialog for selecting a file to be opened in CADMATIC Viewer. These files are supported: DXF, DWG, DWT, DWS, DWF, DGN, DAE, and Plot archive file (.par).
Cadmatic Draw
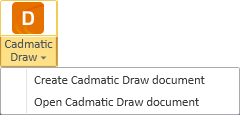
On the Tools tab, if CADMATIC Draw is installed, you can open the Draw application to create or view Draw documents.
-
Create Cadmatic Draw document – Opens CADMATIC Draw.
-
Open Cadmatic Draw document – Opens a dialog for selecting a file to be opened in CADMATIC Draw. These files are supported: DRW, DWG, and DXF.
Other
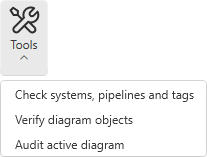
On the Tools tab, the Other group contains the Tools menu with the following tools.
Check systems, pipelines and tags | Verify diagram objects | Audit active diagram
Check systems, pipelines and tags
Select Tools tab > Other group > Tools > Check systems, pipelines and tags to check all systems, pipelines, and tags.
Verify diagram objects
Select Tools tab > Other group > Tools > Verify diagram objects to check for the following kinds of issues in the active diagram:
You can run the verification tool to detect issues that are causing "invalid client data" error messages. The error displays when the application is loading stored object data but cannot find the referred diagram object from the active diagram. This situation may have been caused by sudden loss of database connection or some unexpected error, or by piperuns having been created with zero length in an earlier software version.
If problems are found, the tool prompts you to select how to handle them:
-
If the diagram object cannot be found at all, the tool can remove the stored data.
-
If the diagram object can be found by its OID, the tool can recover the object from ASCII.
You can run the verification tool to detect invalid labels.
If problems are found, the tool displays a list of invalid labels:
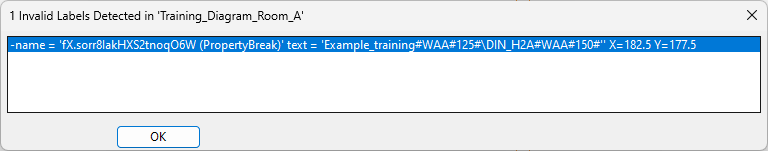
Closing the dialog prompts you to select how to handle the invalid labels:
-
Select Yes to delete the invalid labels.
-
Select No to allow the program to try to fix the invalid labels.
You can run the verification tool to detect invalid nodes. Invalid nodes are caused by corrupted diagram objects.
If problems are found, the tool prompts you to select whether to delete the invalid nodes and their corrupted owner objects.
Audit active diagram
Select Tools tab > Other group > Tools > Audit active diagram to check the DWG format entities of the active diagram and correct any errors it might find.
You can run this tool if you have problems exporting a diagram. If the tool finds issues makes changes to remove those issues, the actions are listed in the message pane:
Update>Tools>Audit active diagram
-Audit error: AcDbBlockTable(1), value: "*Paper_Space" record name "Diagram_BLOCK", validation: Invalid, default: Repaired
-Audit error: AcDbGroup(FF), value: Entry object (106), validation: Invalid, default: Removed
You must save the diagram after this to keep the changes.
Note: Some of the problems that this tool might find but not fix, such as invalid nodes, can be fixed by running Verify diagram objects.
Run
On the Tools tab, the commands in the Run group allow launching other CADMATIC applications.
Script

Select Tools tab > Run group > Script to run a script from the file system.
For more details, see Executing scripts.
Command Prompt

Select Tools tab > Run group > Command Prompt to open the Cadmatic Terminal command-prompt window.